Note /
Distillate draws vs heating oil demand: what the weekly ratio is telling you
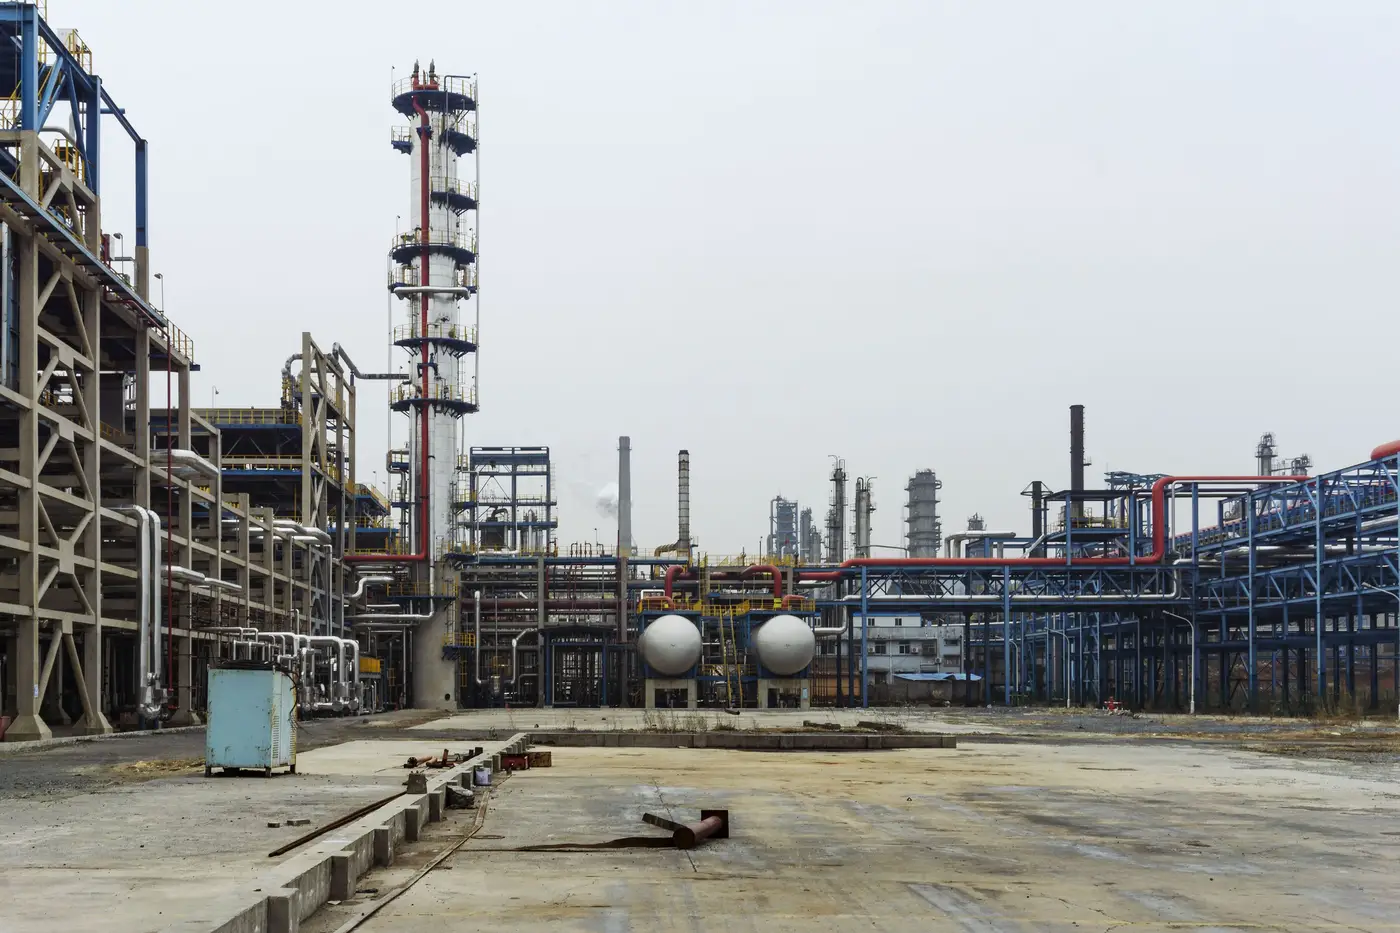
Every October, someone on the desk starts watching distillate stocks like it's the only line on the EIA table. It isn't, but it's the one that moves basis in the Northeast and gets forwarded to the heads of desk with "see below" in the subject line. The question worth asking before you trade the print isn't just how big the draw was. It's whether the draw matches what heating oil demand should look like for that week, given the weather that showed up.
What the draw ratio measures
The draw ratio, loosely, is the weekly change in distillate stocks divided against implied heating oil demand for that same week (distillate product supplied, in EIA terms). Near 1, the draw matches what demand implied it should. Well above 1, stocks fell faster than demand alone explains, usually because refiners pulled back distillate yield, exports ran hot, or both. Below 1 in a cold week, someone is sitting on barrels they didn't need to move yet, or the degree-day number lagged the actual burn.
None of this is exotic math. It's the same arithmetic desks have run since the first winter the Northeast got caught short on heating oil. What's changed is how long you have to wait to run it. The EIA number comes out once a week, on a schedule, three days after the week it describes. By the time distillate product supplied prints, the cold snap that drove it is already old news and the next one is building.
Why the ratio matters more in November than in July
In summer, distillate demand is mostly diesel, and diesel demand doesn't swing on a cold front. From November through February, heating oil layers on top of diesel demand, and heating oil demand is weather-driven in a way diesel isn't. A string of sub-30 days in Boston and Hartford pulls terminal inventory down fast, and that pull shows up in the weekly stocks number with a lag.
That lag is the whole problem. A trader reading the draw ratio in January is really reading last week's weather filtered through a reporting system that was built for a steadier market. If PADD 1 heating oil stocks come in soft against a cold week, you're left guessing whether that's genuine tightness building into February or a reporting quirk that unwinds next week. The ratio tells you something happened. It doesn't tell you whether tank farms in Bayonne or South Portland were still full on the day the number was pulled, or already drawing hard toward the bottom of the tank.
Reading winter heating season crude stocks without waiting for Wednesday
Crude stocks and distillate stocks move for different reasons in winter, but desks that trade the spread between them end up wanting the same thing: a read on what's actually sitting in the tanks between EIA releases, not just on release day. Weekly agency data and terminal self-reporting both lag the market by design, one on a fixed schedule, the other on whatever cadence the terminal operator chooses to disclose.
That gap is why some desks have started pulling an independent stocks read from overhead imagery of the tank farms themselves, measuring the shadow each floating roof casts to estimate fill level, updated from daily satellite passes rather than a weekly filing. It gives you a read on whether the draw is building or stalling in the days before the EIA number comes out, region by region or facility by facility, something the weekly print alone can't show you until it's already a week old.
Before you lean hard on next Wednesday's distillate draw ratio, it's worth asking what the tanks looked like on Monday. If you'd rather not wait for the print to find out, that's the gap Oil Inventory Index is built to close.