Annex / Notes
Blog
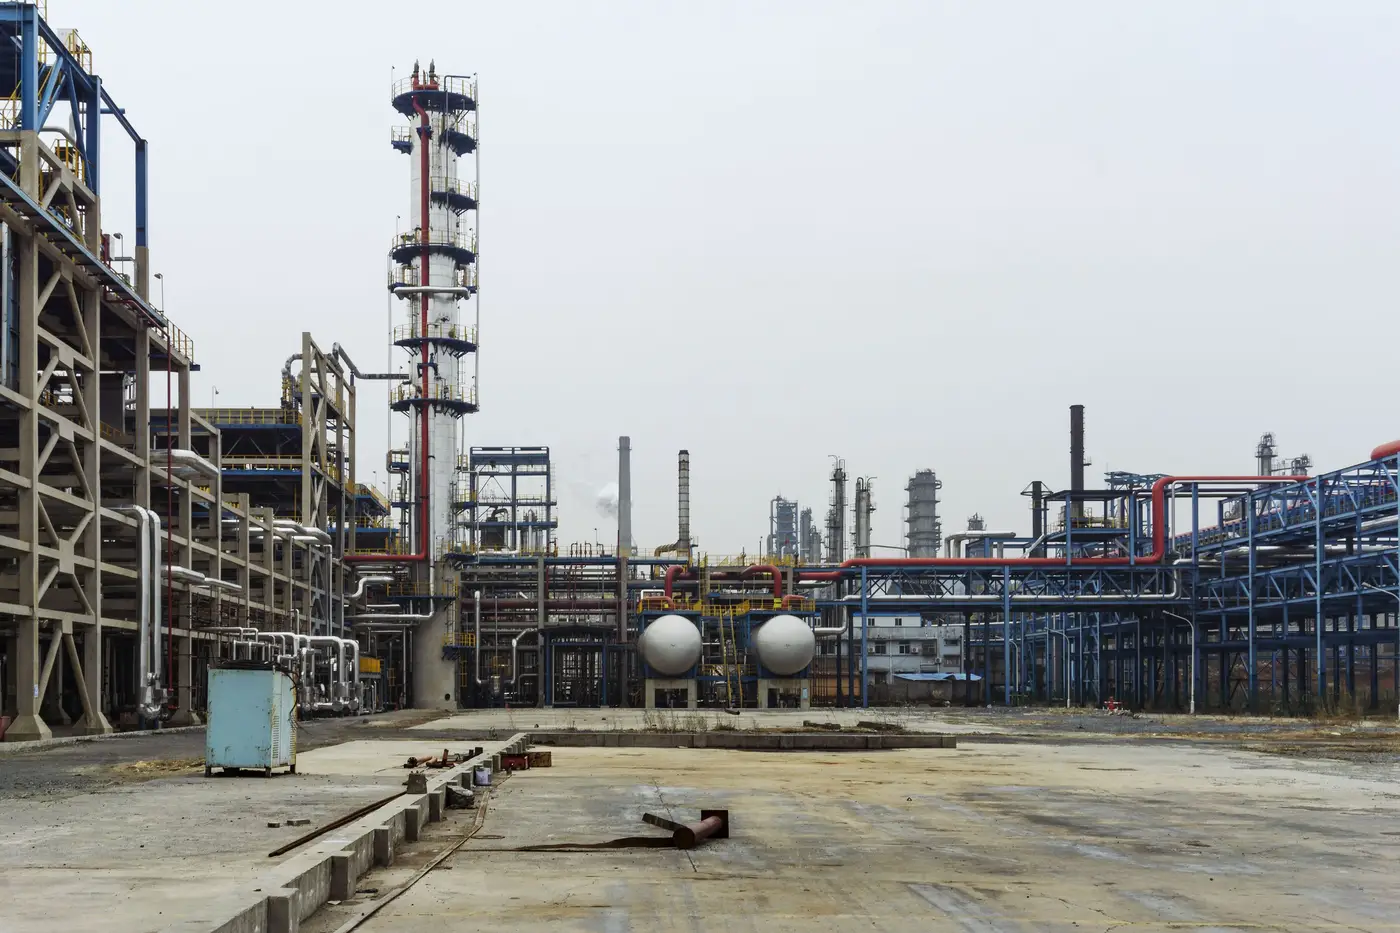 Distillate draws vs heating oil demand: what the weekly ratio is telling you
How to read the distillate stocks draw against heating oil demand before the EIA print, and why the ratio matters more in November than in July.
 Field notes: the week the low winter sun turned every tank shadow into a lie
A field-notes look at how low winter sun angles distort shadow-based tank fill reads, and why a daily series catches the artifact a weekly one can't.
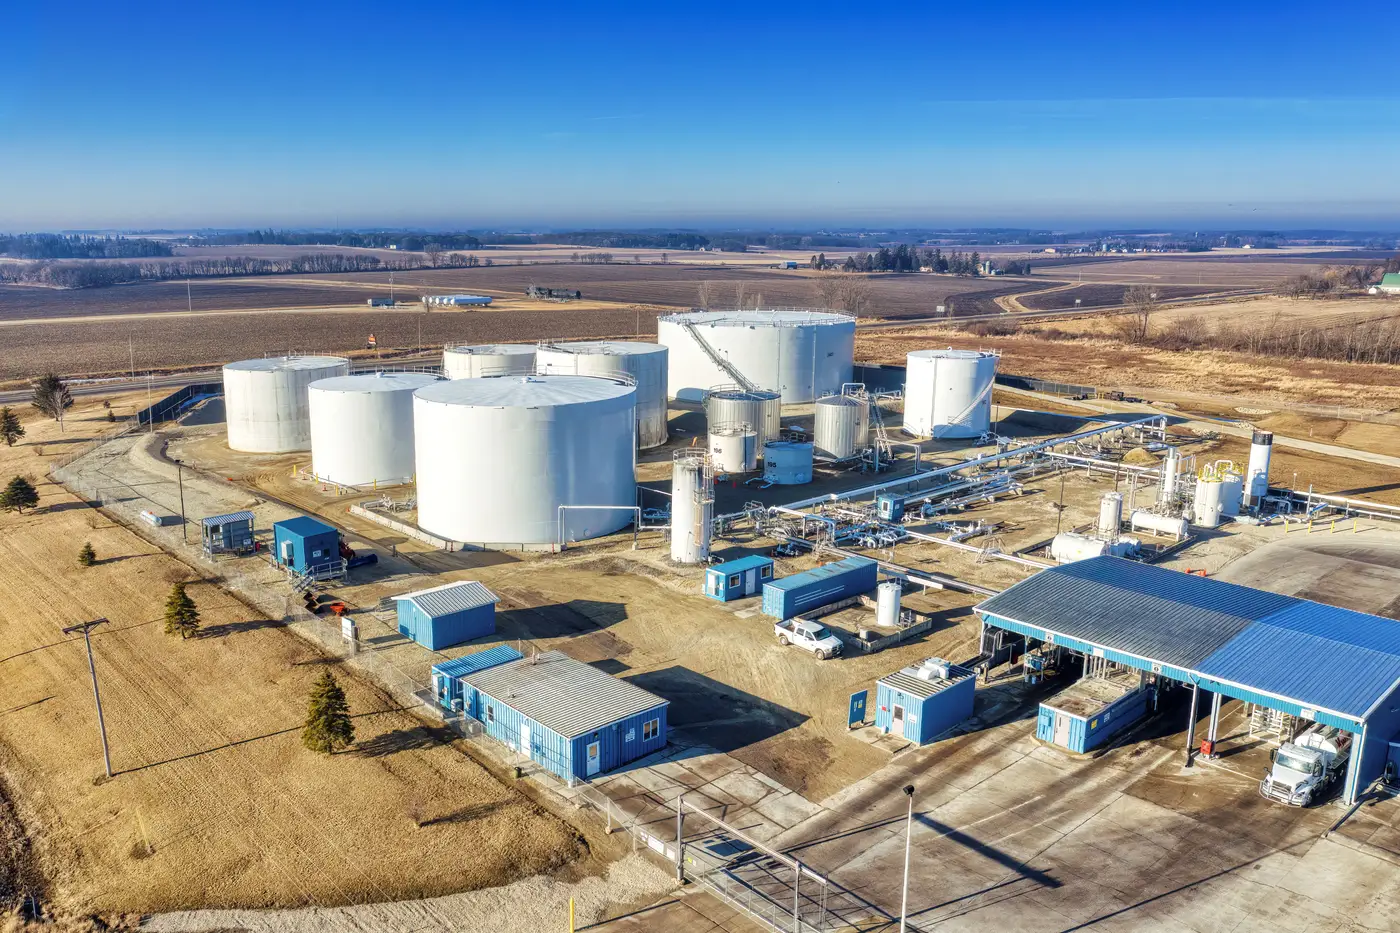 Gasoline stocks vs implied demand: what the weekly mismatch means
A build with flat implied demand, or a draw with soft implied demand: here's what drives the weekly gasoline mismatch and how to read it.
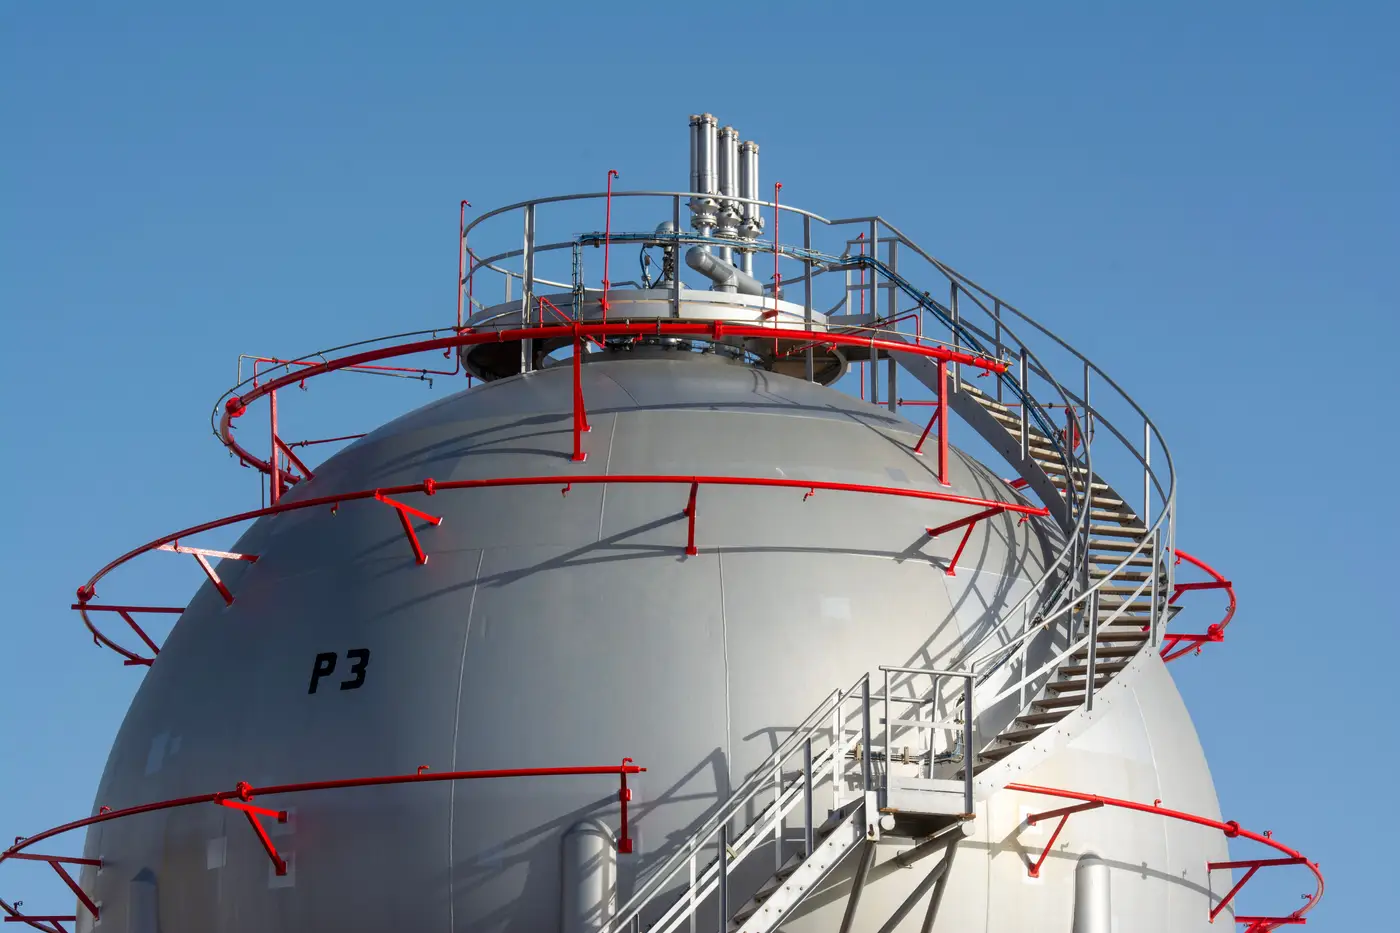 Propane inventory season explained: why November's print hits harder than June's
Propane stocks build all summer and draw all winter. Here's why the EIA's November print carries more weight on the desk than June's number.
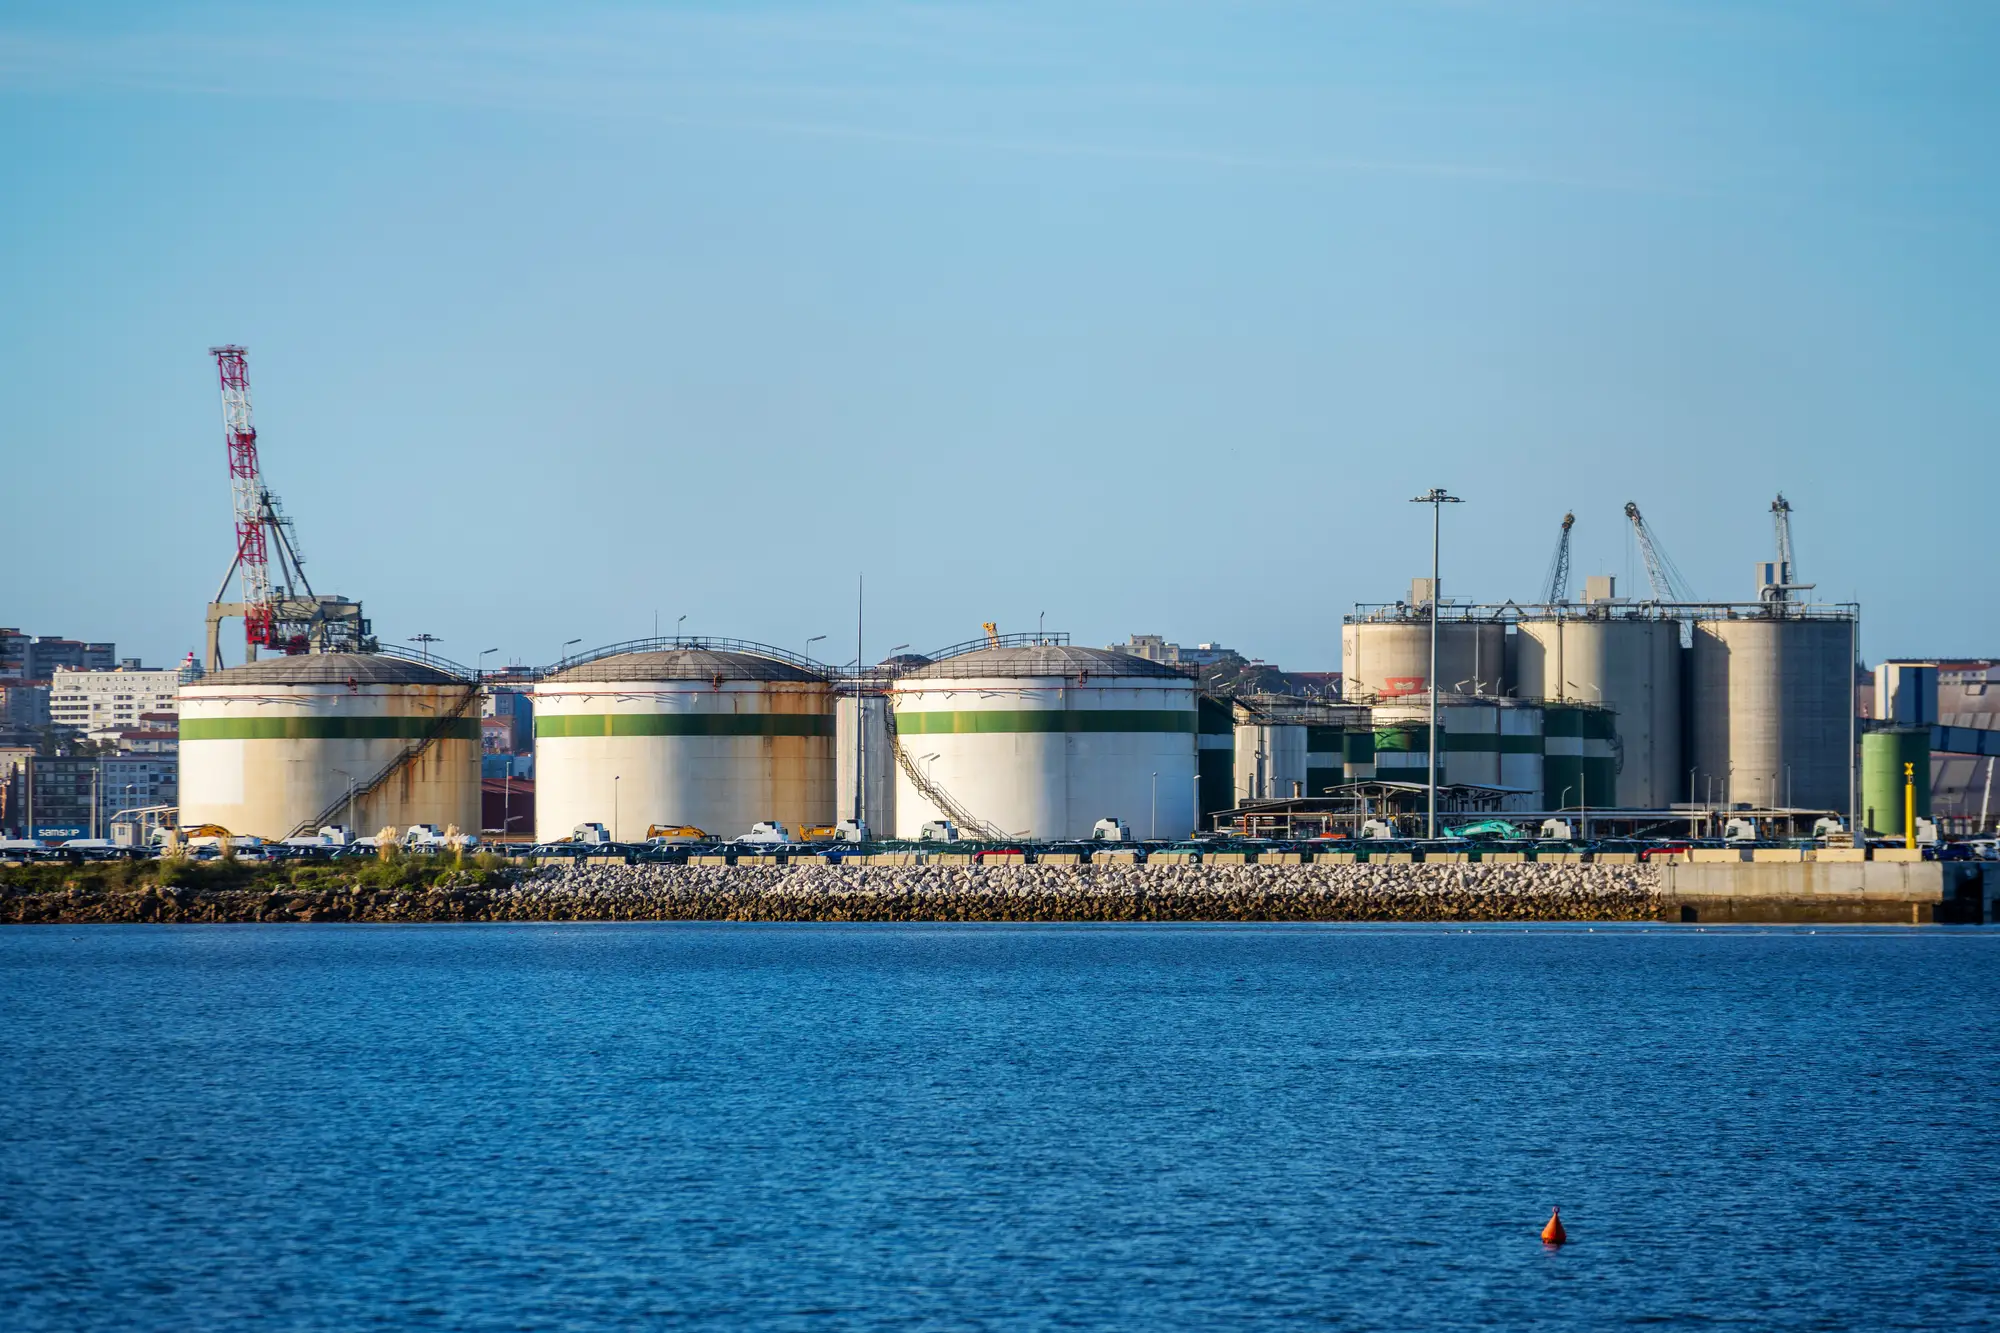 Field notes: a hurricane shuts three refineries, the tanks still fill
A field read on what Gulf Coast tank farms do during a hurricane week, and why the weekly print lags what the roofs are telling you.
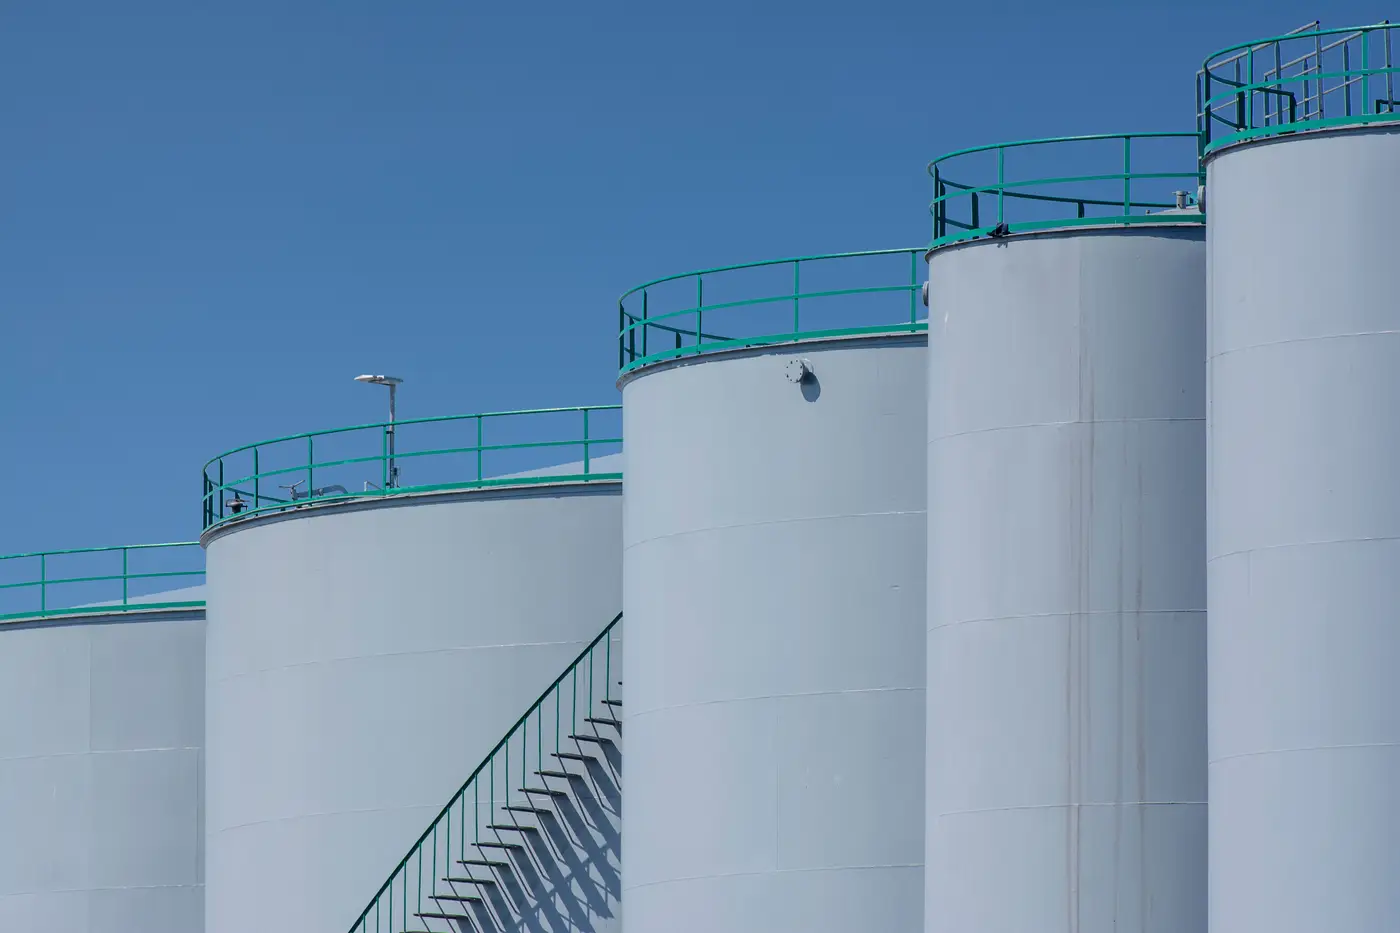 Stock draw vs. stock build: why the barrel count isn't the whole story
Crude stock draw and build definitions, why the weekly headline number can mislead, and what desk analysts check before trading it.
- API gravity vs. the API inventory report: what's the difference
API gravity measures crude density in degrees. The API and EIA weekly reports measure stock levels. Here's how the two concepts differ and why both matter.
- Floating storage vs. onshore tanks: what actually separates them
Floating storage and onshore tank draws move for different reasons. A look at VLCC storage economics and why the two series diverge.
- Field notes: the Wednesday the API number missed by a mile
A field-notes look at the Wednesday API and EIA crude numbers diverged by six million barrels, and what the gap tells a desk.
- What is the Cushing hub, and why it sets the price for WTI
A desk-level explainer on Cushing, Oklahoma: why its tank farms are the NYMEX delivery point and how stocks there move the WTI screen.
- Refinery utilization rate explained: why it swings gasoline and distillate builds
A plain explanation of refinery utilization rate, how it connects to crude runs, and why gasoline and distillate stock builds move the way they do.
- What the crack spread tells you before the draw shows up
How the 3-2-1 crack spread and refining margin signal product inventory draws, especially distillate, ahead of the weekly EIA print.
- Internal vs external floating roof tanks: what the shadow shows
IFR tanks hide their floating roof under a fixed dome; EFR tanks don't. That split decides which tanks a shadow-based stocks read can cover.
- What a strapping table actually is, and why every volume number traces back to it
A plain explanation of tank strapping tables, how shell capacity gets measured, and why the gauge chart behind every barrel count matters to a desk.
- API vs EIA crude oil inventory: what's the difference
Why the API bulletin and EIA weekly report rarely match, and what the gap between them tells a trading desk.
- Contango vs backwardation: what the curve shape means for storage economics
How contango and backwardation drive the cost-of-carry math behind crude and floating storage, and why the curve and the tank count don't always agree.
- Shell capacity vs working storage capacity for crude tanks
What shell capacity, working capacity, tank heel, and freeboard mean for crude storage, and why the gap matters when you're sizing a stocks move.
- What is a PADD region, and why crude stocks get reported by district
PADD regions explain why PADD 3 Gulf Coast and PADD 2 Midwest crude stocks move markets differently than the national total.